
Why Digging Deeper to Reveal the Root Cause of a Problem
Product designer, I’ll teach you how to unleash your inner UX detective! Learn how to dig deep, identify root causes, and address the real problem of users.
As someone who’s been around product development for a while, I’ve seen my fair share of problem-solving-oriented people and the opposite. Today, I’m here to share my insights on the importance of problem-solving in product design. Precisely how effective problem-solving techniques are like treasure maps.
I’ll share with you some of the techniques I’ve learned to identify the root cause of problems in product design. Also, I’ll share stories from my time at Flexpipe, where lean manufacturing principles guided my approach to problem-solving.
As a consultant for Flexpipe, a business that builds modular system equipment for lean manufacturing, I was able to structure their new digital marketing department while creating a content strategy for their new commerce website. This project lasted over three years, during which I gained extensive knowledge about lean manufacturing and its philosophy.
While at Flexpipe, I noticed how the lean manufacturing mindset could greatly benefit the UX design process. Both fields are about efficiency, waste reduction, and, most importantly, problem-solving, right? By applying lean principles to UX design, we can streamline our process and deliver innovative solutions that truly add value to the end user.
This article will go over the following:
- Why Defining the Real Problem Matters
- The 5 Whys technique
- The Fishbone Diagram technique
- The Fault Tree Analysis technique
- How the 80/20 rules can help prioritize your solution
- Conclusion
Grab a coffee, and let’s embark on a journey to UX greatness!
Why Defining the Real Problem Matters
First, you can only hit a target if you know what you’re aiming for, right? The same goes for problem-solving. If you don’t clearly understand the issue, your attempts at finding a solution will be like shooting in the dark.
Here are a few reasons why it’s crucial to clarify the issue before diving into root cause analysis:
- Avoids misdirection: A clear problem statement keeps everyone on the same page and prevents team members from going down rabbit holes or chasing after red herrings.
- Sets boundaries: Knowing what you’re not trying to solve is essential. Defining the problem helps establish the scope of your efforts and prevents scope creep.
- Facilitates collaboration: When everyone understands the problem, communication and cooperation are smoother, which is especially important when working with cross-functional teams.
Simply put, clarifying the problem is like turning on the lights and revealing the bullseye.
The Value of Gathering Initial Data and Observations
Gathering initial data and observations is essential in understanding the issue at hand and zeroing in on the root cause. After all, we don’t want to be the ones who jump on the first solution to quickly release the product, right?
Here’s why gathering initial data and observations is so important:
- Provides context: Data helps us understand the problem within the broader context of user behavior and business goals.
- Unearths hidden insights: Sometimes, the most valuable insights are buried deep within the data, waiting to be discovered.
- Guides decision-making: Data-driven decisions lead to more effective and user-centric solutions.
- Reduces guesswork: Let’s face it, nobody likes playing the guessing game—especially when it comes to UX design.
One valuable lesson I learned at Flexpipe was the importance of a data-driven approach. By gathering and analyzing data, we identified bottlenecks and inefficiencies in the manufacturing process, ultimately leading to more streamlined and effective solutions. This same approach can be applied to UX design. Understanding the user’s needs and pain points is essential for creating successful products.
Enough theory. Now, let’s get into the technical side of root cause analysis.
Digging Deep: Root Cause Analysis Techniques Uncovered
Do you know that UX designers are like detectives? It’s true! They share several key qualities and responsibilities, such as:
- Investigate: Like detectives piecing together clues to solve a mystery, UX designers gather information to understand user behavior, needs, and pain points. They analyze user research, usability testing, and analytics data to uncover insights.
- Ask Questions: Detectives ask questions to gather information and uncover the truth. In contrast, UX designers ask questions to understand user motivations and experiences. Techniques like “The 5 Whys” and user interviews help UX designers identify the root cause of an issue.
- Solve Problems: Detectives solve crimes, while UX designers solve user experience crimes. Both roles require critical thinking, creative problem-solving, and the ability to connect the dots between seemingly unrelated pieces of information.
- Empathy: Detectives must put themselves in others’ shoes to understand motives and actions. Just as UX designers need empathy to understand users’ needs, emotions, and expectations.
As a UX detective, here’s my favorite tool to shed light on the underlying issues that can plague our products. The following techniques have helped my team create real user-centric solutions.
Technique 1: The 5 Whys
This technique is all about asking “why” iteratively to reveal the underlying issues. It helps peel back all the layers and get to the core of the problem. So, are you ready for a game of whys?
Collaborative Workshops: The 5 Whys in Action
Imagine conducting a workshop with your team. You’ve noticed the high user drop-off rate during the sign-up process. Time to put on your detective hat and ask “why”!
- Why are users dropping off during the sign-up process? The form is too long.
- Why is the form too long? It asks for unnecessary information.
- Why are we asking for unnecessary information? We assumed it would help create a personalized experience.
- Why did we make that assumption? We didn’t validate it with users.
- Why didn’t we validate it with users? We were too focused on the deadline.
Aha! The root cause is revealed: lack of user validation. Time for some user research!
User Research: The 5 Whys Strikes Again
It would be best if you also used this technique during user research. Let’s say you’re conducting a user interview, and the participant mentions they find the app confusing. Time for another round of “why”!
- Why do you find the app confusing? The navigation is unclear.
- Why is the navigation unclear? The labels aren’t descriptive.
- Why aren’t the labels descriptive? They use jargon.
- Why do they use jargon? The design team thought it sounded professional.
- Why did the design team think that? They didn’t consult with actual users.
Once again, the root cause is exposed: lack of communication with users.
Applying Insights: Turning Whys into Wows
Now that you’ve uncovered the root causes using “The 5 Whys,” it’s time to apply these insights to create a better user experience. In both examples, the key takeaway is the importance of user validation and communication. By incorporating user feedback and testing assumptions, we can create more user-centric designs that wow our audience.
Do I Really Need to Ask Why 5 Times?
Great question! While the “5 Whys” technique gets its name from the idea of asking “why” five times, the number of times you actually ask “why” can vary depending on the situation. The key is to ask “why” enough times to uncover the root cause of a problem.
Sometimes, you might find the root cause in just 3 or 4 questions; other times, it could take 6 or more iterations. The important thing is not to stop at the surface-level symptoms but to keep asking “why” until you identify the underlying issue driving the problem. It is a guideline to encourage deeper analysis and ensure you don’t stop prematurely in your investigation.
So, don’t be afraid to ask “why” as often as you need to dig deep into the issues. Armed with “The 5 Whys” technique, you’ll be well on your way to uncovering the root causes of problems and creating better user experiences. And remember, when in doubt, ask “why”!
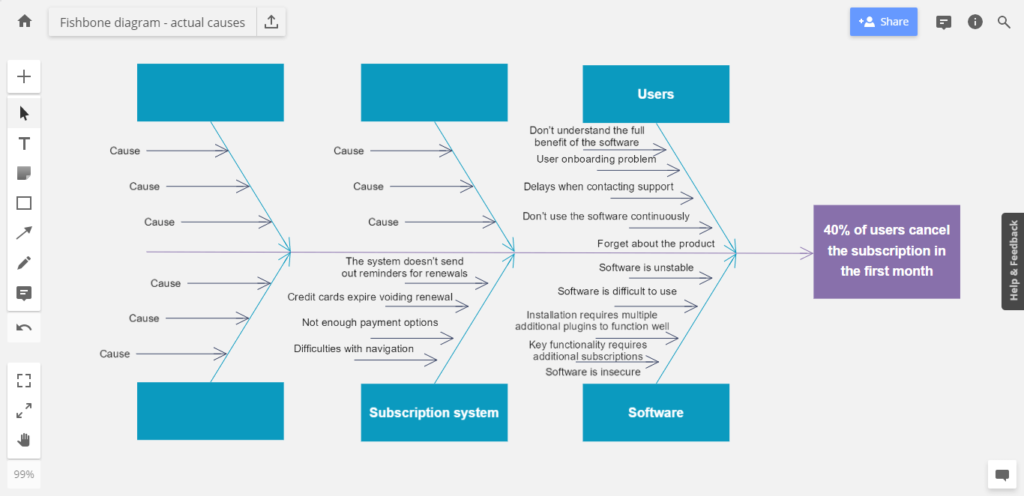
Technique 2: The Fishbone Diagram
The Fishbone Diagram, also known as the “Ishikawa Diagram,” helps better visualize the potential causes of a problem. It pictures a fish skeleton, with the “head” representing the problem and the “bones” representing categories of possible causes.
This diagram is more than just a pretty picture. It allows us to analyze the relationships between different causes and pinpoint areas where we should focus our efforts. So, let’s reel in the big insights and tackle the most pressing issues.
Collaborative Workshops: Casting the Net
Imagine using the Fishbone Diagram during a collaborative workshop. Your team is brainstorming possible reasons for a drop in user engagement. During the brainstorming session, the team would add potential causes under each category on the Fishbone Diagram.
Example:
- People
a. Inadequate customer support
b. Ineffective communication of app features
c. Insufficient onboarding process - Processes
a. Lack of user feedback integration
b. Inefficient app update testing
c. Inconsistent design patterns - Technology
a. Slow app performance (specifically after the recent update)
b. Frequent app crashes
c. Device compatibility issues - Environment
a. Increased competition from similar apps
b. Shift in target audience preferences
c. Changes in the market landscape
As they discuss and analyze the issues, the team might notice a pattern emerging: many user complaints are related to slow app performance and crashes that began after the recent update.
Reeling in the Insights: Applying The Findings
By focusing on the “Technology” category, the team could further investigate the app update and identify it as the primary cause of the drop in user engagement. The Fishbone Diagram would visually represent this conclusion by having the “head” of the fish pointing to the recent app update within the “Technology” category, with a clear emphasis on performance issues.
In this scenario, the team is encouraged to embrace their inner fisherman. The Fishbone Diagram serves as a valuable tool for organizing ideas, identifying patterns, and ultimately discovering the root cause of the problem. With this information, the team can now resolve the performance issues and enhance the user experience.
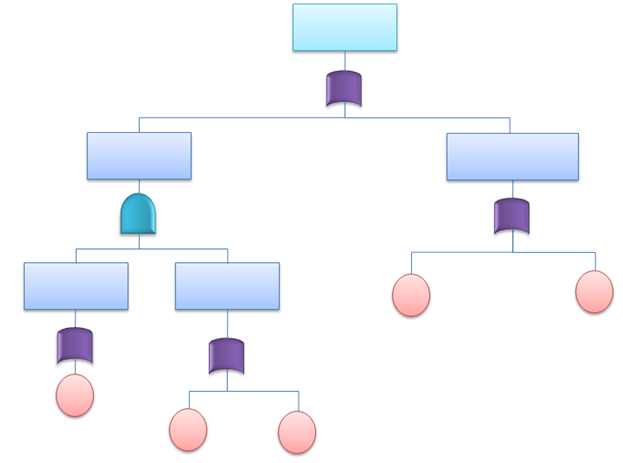
Technique 3: Fault Tree Analysis
FTA is a top-down approach to map out the logic behind failures. Helping you uncover how multiple factors can contribute to a specific problem. This method also allows you to assess the likelihood of each contributing factor, which enables you to prioritize solutions based on their potential impact.
Collaborative Workshops: The FTA in Action
Let’s imagine a real-life scenario where an e-commerce website is experiencing a sudden drop in conversion rates. We’ll use Fault Tree Analysis (FTA) to systematically uncover the potential root causes of this problem in product design.
Top Event: Decreased Conversion Rates
- Poor User Experience (UX)
a. Complicated navigation
b. Slow website loading times
c. Inadequate product information
d. Non-responsive design (poor mobile experience) - Technical Issues
a. Broken add-to-cart functionality
b. Problems with payment processing
c. Server downtime affecting site availability - Trust and Security Concerns
a. Lack of clear privacy policy
b. Absence of trust seals (e.g., SSL certificate)
c. Insecure payment processing methods - Marketing and Messaging
a. Ineffective or misleading promotions
b. Poorly targeted marketing campaigns
c. Insufficient or unclear calls-to-action (CTAs)
In this example, the FTA begins with the top event (decreased conversion rates) and breaks it down into four main categories. Each category is then further divided into specific issues that may contribute to the problem. By systematically analyzing these factors, the product design team can pinpoint areas that require improvement and prioritize their efforts accordingly.
Applying FTA Insights to Product Design
Once you’ve identified the root cause(s) of a problem, you can start addressing them in your design process. This might involve changing the user interface, rethinking the user flow, or improving the underlying technology. The insights from FTA will guide you in making informed decisions, ensuring your product meets both user needs and business goals.
Remember, as a UX designer, you’re also a detective. Fault Tree Analysis is a powerful tool in your problem-solving arsenal.
With these techniques in your problem-solving arsenal, you’ll be ready to tackle even the most complex UX challenges.
Zeroing in on the Right Solutions: Prioritizing and Planning for Success
As a senior product designer, I’ve seen firsthand how vital it is to prioritize and plan solution implementation. Identifying the root cause of a problem is only half the battle; you need to be strategic about addressing those issues to make a real impact on your product design.
The 80/20 Rule: Focus on What Matters Most
You might have heard of the Pareto principle or the 80/20 rule, which states that 80% of the effects come from 20% of the causes. In product design, this means identifying the most impactful causes and focusing your efforts on solving them.
1- Pinpointing High-Impact Causes
Once you’ve identified the root causes of a problem, prioritize them based on their potential impact on the user experience and overall product success.
Here’s a short guide on how to do it:
- List all potential causes: Begin by listing down all the potential causes you’ve identified through your root cause analysis. Be as comprehensive as possible to ensure you don’t miss any important factors.
- Evaluate the impact of each cause: Assess each cause’s potential impact on user experience, product performance, and business goals. Consider the severity of the issue, the number of users affected, and its overall influence on your product’s success.
- Assign a priority score: Give each cause a priority score based on its potential impact. This score can be a simple ranking (e.g., high, medium, low) or a numerical value. The higher the score, the greater the impact the cause has on your product.
- Sort the causes by priority: Organize your list of causes by their priority scores, starting with the highest impact causes at the top. This will help you focus your problem-solving efforts on the most critical issues first.
- Review and refine the list: Periodically review and update your priority list as new information or insights become available. This ensures that you’re always focusing on the most impactful issues.
Now, you can efficiently allocate resources and efforts to address the most critical problems in your product design.
2- Hypothesis Testing
With your priority list in hand, it’s time to test your hypotheses. This process allows you to validate your assumptions and make informed decisions about which solutions to keep and which to discard.
Here’s a short guide on how to conduct hypothesis testing in the context of product design:
- Formulate a clear hypothesis: Start by stating your assumption as a testable hypothesis. This should be a clear, concise statement that predicts the relationship between variables or the expected outcome of a change. For example, “Adding a progress indicator to the onboarding process will increase user engagement by 15%.”
- Determine your success metrics: Identify the key performance indicators (KPIs) or metrics that you’ll use to measure the success of your hypothesis. In the example above, user engagement could be measured by the completion rate of the onboarding process.
- Design an experiment: Plan an experiment to test your hypothesis. This could involve creating a prototype, implementing the proposed change in a controlled environment, or conducting A/B testing, where you compare the new design’s performance against the current design.
- Collect data: Execute the experiment and collect data related to your success metrics. Make sure to gather enough data to ensure the results are statistically significant.
- Analyze the results: Analyze the data to determine whether it supports or refutes your hypothesis. Calculate the difference in performance between the experimental group (new design) and the control group (current design). Check if the results are statistically significant to validate the findings.
- Draw conclusions: Based on the analysis, decide if the results support your hypothesis. If the data confirms your thesis, consider implementing the change in your product. If not, re-evaluate your assumptions and iterate on your theory or design.
Following these steps, you can use hypothesis testing to validate your assumptions, make data-driven decisions, and improve your product design based on real-world evidence.
Keep an Eye on Success Metrics and User Feedback
As you roll out solutions, monitoring success metrics and user feedback is crucial. By keeping tabs on key performance indicators (KPIs) and gathering input from users, you’ll gain valuable insights into the effectiveness of your solutions.
Here’s a brief guide on how to do that:
- Select relevant success metrics: Identify the key performance indicators (KPIs) that align with your product goals and are most pertinent to the design changes you’ve made. These could include user engagement, conversion rates, user retention, or task completion time.
- Set up tracking and monitoring: Implement tools and processes to track your chosen success metrics continuously. This could involve using analytics platforms, user behavior tracking software, or custom-built monitoring solutions.
- Establish a baseline: Determine the baseline performance of your success metrics before implementing the design changes. This will serve as a reference point to compare the impact of your updates.
- Gather user feedback: Collect user feedback through various channels, such as surveys, user interviews, focus groups, or in-app feedback mechanisms. User feedback provides valuable qualitative insights that can help you identify potential issues or areas for improvement that may not be apparent from quantitative data alone.
- Analyze and interpret data: Regularly analyze your success metrics and user feedback to assess the performance of your design changes. Look for trends, patterns, and any significant deviations from the baseline to determine if the updates are having the desired effect.
- Iterate and improve: Based on the insights from your success metrics and user feedback, identify areas where you can further optimize your design. Iterate and refine your product design as needed, and continue monitoring performance to ensure ongoing improvement.
Remember, a solution is only truly successful if it positively impacts the end-user experience and achieves your business goals.
So, embrace your inner detective and create products that users love!
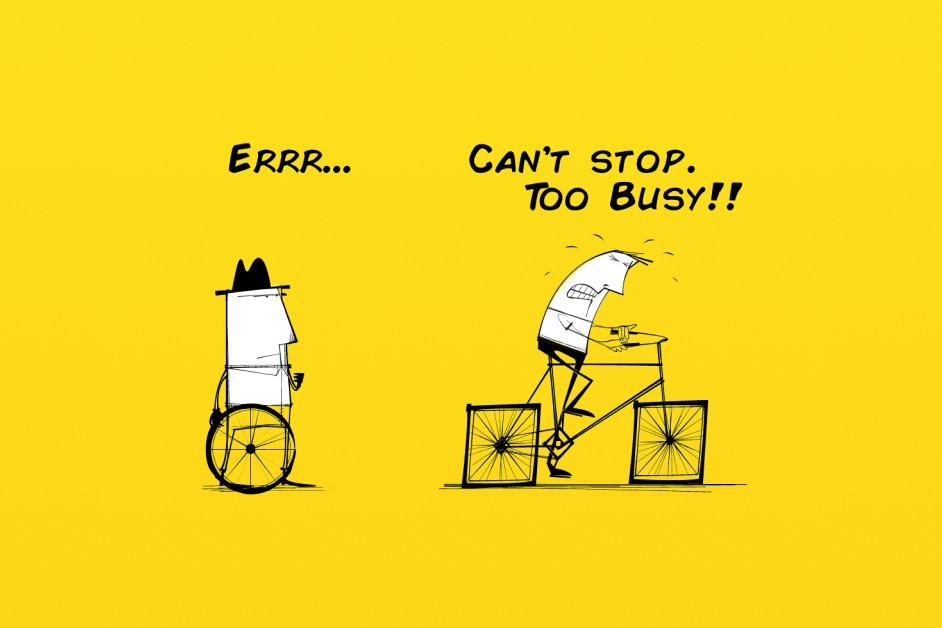
Conclusion: Don’t Ride a Bike with Squared Wheels!
I cannot stress enough the importance of root cause analysis in product design. Identifying and addressing the root causes of issues allows us to create more effective, user-centric solutions, ensuring our products remain innovative and profitable. As Mikel Harry, co-creator of Six Sigma, once said, “If you don’t work on the right problem, it doesn’t matter how hard you work.”
Remember the cover image of this article? You know, the one with a man pushing hard on the bike with square wheels while ignoring the other man holding a round wheel in his hand. It’s a hilarious yet powerful reminder that focusing on symptoms rather than the root cause can lead to wasted effort and missed opportunities. In my three-year project with Flexpipe, I witnessed firsthand the power of lean manufacturing principles, like 5S and TPS, in driving innovation and efficiency.
So, let’s commit to digging deeper and fostering a problem-solving mindset. After all, nobody wants to be that person riding a squared-wheel bike, right?
Comments are closed.